Google Adsense is the most popular monetenizing program for websites, but the Adsense reports are very simple and does not show any charts and graphs, so that we can have better information.
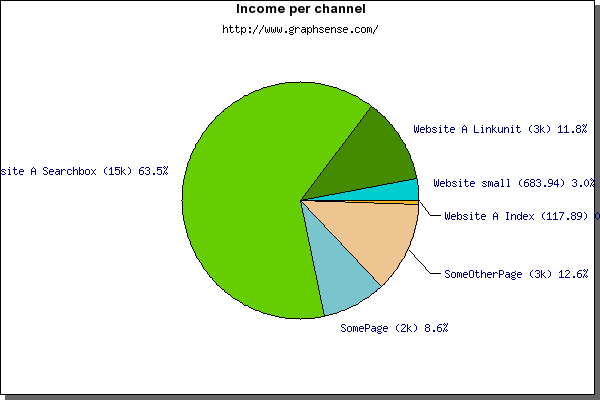
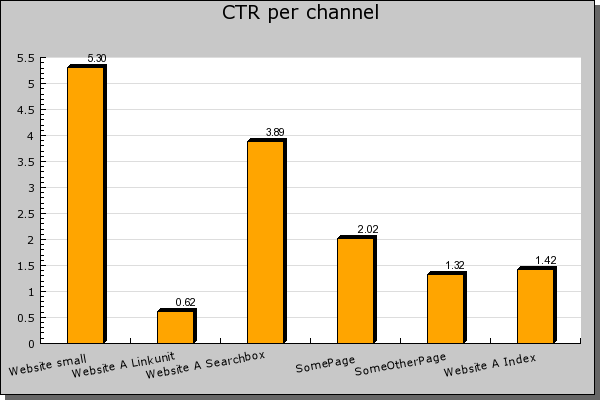
Graphsense is a Firefox add-on which has the ability to plot graphs for your Adsense reports. Once you install add-on, select ‘advanced report’ in your adsense account and all the details like income, CTR, clicks etc will be displayed in the form of graphs and charts. Right now there are three types of graphs that can be generated, lines, pies and bar/columns.
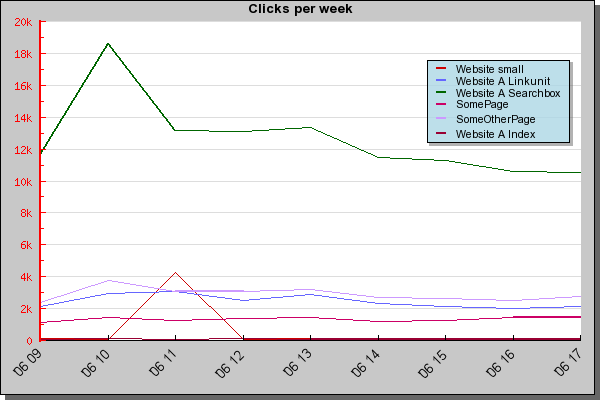
Important thing to note is that the graph is plotted based on the data you select on Advanced Report, so make sure you have fetched enough data to plot graphs and charts.


This seems a useful add on.. However, I am not sure if I’d like to overload my plugin list anymore..
@Vijay,
This plugin is for people not satisfied with current display.
Now this is interesting. I think I just might try it out. Thanks for the heads up buddy 😀
Looks interesting…. Will try this out soon. 🙂